
PACE’s journey from ocean-colour optics to validated data
PACE links ocean colour with atmospheric polarimetry. Prototypes, spacecraft tests and field campaigns trace how its measurements of seas and skies are checked.
One mission for the ocean and atmosphere
NASA’s Plankton, Aerosol, Cloud, ocean Ecosystem mission, or PACE, brings observations of marine microorganisms together with measurements of airborne particles. At a prelaunch briefing on 5 February 2024, NASA associate administrator Jim Free identified the interaction between ocean life, aerosols and cloud formation as a central scientific question. A Falcon 9 carrying the satellite rolled to its Florida launch pad that morning. Weather delayed the departure originally planned for 6 February, with the launch eventually scheduled for 8 February. The mission would join NASA’s wider Earth-observing fleet, connecting measurements of oceans and the atmosphere rather than studying either environment in isolation. Its subsequent engineering checks, first observations and field campaigns established how those measurements could be collected and assessed.
From ORCA and AirHARP to flight instruments
PACE’s Ocean Color Instrument, or OCI, grew from the Ocean Radiometer for Carbon Assessment prototype developed at NASA Goddard in the early 2000s. ORCA demonstrated a telescope rotating six times per second while synchronising with charge-coupled detectors. These semiconductor devices turn the telescope’s projected light into digital images. The synchronised design opened the way to measurements across many narrow spectral bands. Charles McClain led ORCA until his retirement in 2013; Gerhard Meister subsequently took over the project and became OCI’s instrument scientist.
Another development chain began with AirHARP, an aircraft-mounted polarimeter, and the HARP CubeSat. By the time the University of Maryland, Baltimore County discussed a PACE instrument in 2016, those projects had already advanced its optical design. HARP2 retained their wide-angle optical system, viewing Earth from up to sixty angles without moving parts. Its design provided a spatial resolution of about 2.6 kilometres per pixel. NASA’s Earth Science Technology Office supported both prototype lines before their incorporation into the observatory. The compact polarimeter also addressed an engineering constraint: atmospheric interference could compromise ocean-colour measurements, so the platform needed additional atmospheric observations without a large instrument.

The platform around the sensors
The fully fuelled PACE spacecraft stood about ten feet tall and weighed 3,748 pounds. Its propulsion system carried approximately 235 kilograms of hydrazine in one tank feeding eight thrusters. Three solar panels formed an array measuring roughly 100 by 173 inches, with about 2.7 kilowatts of electrical output at the beginning of operation. These launch and beginning-of-life specifications describe the platform supporting the scientific payload.
The planned sun-synchronous polar orbit lay about 420 miles above Earth. At approximately 16,800 miles per hour, the spacecraft would complete an orbit in 98.3 minutes. The payload combined three complementary measurement systems:
The science instruments
- OCI, the primary ocean-colour instrument, measuring the light associated with phytoplankton and sunlight.
- SPEXone, the Spectro-polarimeter for Planetary Exploration, contributed by a consortium in the Netherlands.
- HARP2, a second polarimeter contributed by the University of Maryland, Baltimore County.
A month inside the thermal-vacuum chamber
Before shipment to Florida, PACE completed a six-month environmental test campaign at Goddard in Greenbelt, Maryland. The final environmental test placed the observatory in a thermal-vacuum chamber to reproduce the low pressure and temperature extremes expected in space. A week of chamber preparation in June preceded the test itself. Instrument and spacecraft teams checked their equipment before the chamber closed, while control-room staff prepared to monitor the observatory as power was applied.

The enclosed test lasted about 33 days. Teams worked three shifts to maintain operations around the clock, checking the spacecraft at the expected thermal extremes. Environmental testing finished in August 2023. Two further tests at normal pressure and temperature remained before preparations for transport to the launch site. At the time, the mission still anticipated an early January 2024 departure.
Launch from Cape Canaveral
PACE launched on a SpaceX Falcon 9 at 1:33 a.m. Eastern Standard Time on 8 February 2024. The rocket departed Space Launch Complex 40 at Cape Canaveral Space Force Station in Florida, United States. NASA acquired the spacecraft’s signal about five minutes after liftoff. The mission’s ultraviolet, visible and near-infrared observations were intended to identify phytoplankton communities and help researchers follow changes in marine environments, including harmful algal blooms and fisheries conditions.
Goddard managed the mission and built and tested both the spacecraft and OCI. NASA’s Launch Services Program at Kennedy Space Center managed the launch service. The University of Maryland, Baltimore County designed and built the Hyper-Angular Rainbow Polarimeter 2. A Dutch consortium involving the Netherlands Institute for Space Research, Airbus Defence and Space Netherlands developed SPEXone. The three instruments would also examine aerosol and cloud properties, allowing scientists to study the connection between atmospheric particles and ocean biology using observations from the same spacecraft.

Why phytoplankton communities matter
Phytoplankton live near the water’s surface and support the aquatic food web, feeding organisms from shellfish to fish and, through the wider food chain, marine mammals. Thousands of species occupy different ecological niches. Temperature, nutrient supply and sunlight can change which populations flourish. Their pigments alter the light leaving the water, allowing satellites to follow changes in abundance and community composition across large areas.
The organisms also influence the carbon cycle. Photosynthesis draws carbon dioxide into cellular material; some populations carry carbon deeper as they die and sink, while decay near the surface can return it to the atmosphere. Other communities can form harmful blooms. The atmosphere supplies part of their environment: dust and wildfire ash deposited in the ocean can deliver nutrients such as iron. Airborne particles also provide surfaces on which water condenses to form clouds. Ship tracks provide a visible example: water vapour condenses on vessel emissions, producing bright, low-lying clouds. Measuring biological colour signatures alongside atmospheric particles supports investigation of these linked processes, including the different roles of individual plankton communities.
Colour, viewing angle and polarisation
When sunlight interacts with a cloud droplet or aerosol particle, its oscillations can become preferentially aligned: the light is polarised. Measurements of that polarisation provide information about the particles that scattered it, including their size, composition and abundance. Sea salt, dust, wildfire smoke and human-generated pollution create different atmospheric conditions. Aerosols can scatter sunlight back into space or absorb it, while their interactions with clouds remain an important source of uncertainty in climate models.

The two PACE polarimeters sample this information differently. HARP2 observes four wavelengths from up to sixty angles. SPEXone examines a narrower ground swath at five viewing angles, but collects hyperspectral information across a broad range of colours. UMBC built HARP2; the Netherlands Institute for Space Research, or SRON, and Airbus Netherlands built SPEXone in the Netherlands. Their differing angular and spectral sampling complement one another. The measurements are intended to improve descriptions of particle properties, cloud formation and the balance between absorbed and reflected solar energy.
Preparing practical uses before launch
PACE’s Early Adopter programme connected the mission team with applied scientists and environmental professionals before launch. The work covered fisheries, aquaculture, water resources, air quality, health and other applications. The Costa Rican Fishing Federation’s pezCA mobile app already distributed satellite-derived information about ocean temperature, chlorophyll and currents. Its developers planned to add PACE-based information identifying particular harmful algal communities once the new data became available.
Other planned uses concerned areas with relatively few ground-based air-quality monitors. A University of Oklahoma team intended to track how aerosols move, change altitude and interact with other particles across the central United States. Work with tribal nations included information relevant to smoke exposure during prescribed burning. Marine researchers also planned to use phytoplankton observations to assess the habitats supporting fish and mammals. PACE observes the plankton communities near the surface; it does not directly detect fish or marine mammals beneath the water. Those application plans connect satellite products with local decisions without replacing direct environmental observations.

The first public science-quality observations
NASA began publicly distributing PACE’s science-quality data on 11 April 2024 after weeks of in-orbit testing. One released OCI observation, collected off South Africa on 28 February, distinguished Synechococcus from picoeukaryote communities. The presentation compared a natural-colour view, a community-classification product and chlorophyll-a concentration. The classification colours identified categories in the product rather than reproducing the water’s appearance. OCI measures more than two hundred wavelengths, compared with the handful available to earlier ocean-colour sensors. Those additional spectral measurements support distinctions between communities with different pigments.
SPEXone observations from 6 March over Ethiopia and 16 March over Japan illustrated a separate atmospheric distinction. Fine particles over Ethiopia absorbed sunlight in a pattern characteristic of biomass-burning smoke. Fine particles near Japan showed less absorption, consistent with urban pollution mixed with sea salt. HARP2 observations over the west coast of South America on 11 March captured a cloudbow, whose polarisation contains information about cloud droplets. These examples combined different acquisition dates and instrument capabilities in the April release, rather than representing a single simultaneous view of the planet.
Reading the images as scientific products
A June 2024 visualisation used PACE observations from 21 March to show waters off the United States’ East Coast and the Bahamas. It separated picoeukaryotes, Prochlorococcus and Synechococcus into different displayed colours. Chlorophyll measurements indicate the presence and abundance of photosynthetic organisms; community products add information about the groups contributing to that signal. The three displayed groups represent a small part of the diversity that scientists seek to identify with the instrument.

The same visualisation placed a broad HARP2 aerosol swath alongside the narrower SPEXone measurements. HARP2’s scattering and absorption information helped locate and characterise airborne particles; the near-coastal aerosols were considered likely to include smoke from fires in the southeastern United States. SPEXone added information about particle size along its narrower track. Interpreting the display therefore involves the observation date, the measured property and the instrument footprint. A community classification, chlorophyll concentration and aerosol-size product describe different features, even when presented together over a common geographical background.
Matching the satellite with ships and aircraft
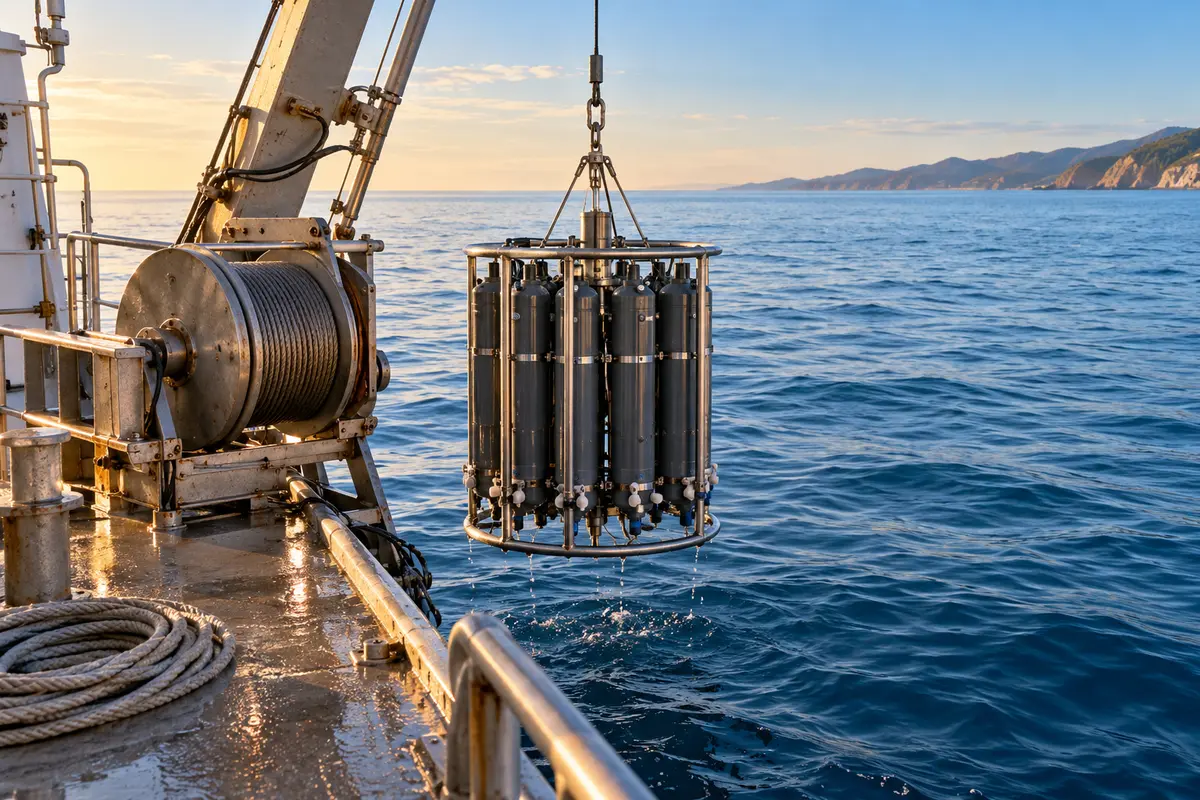
The PACE Postlaunch Airborne eXperiment, or PACE-PAX, began in September 2024 with more than a hundred participants working from locations including Marina, Santa Barbara and Edwards in California. Research vessels collected water samples to identify phytoplankton and their relative abundance, alongside measurements of the water’s optical properties. These observations supplied surface comparisons for OCI’s view from orbit.
A Naval Postgraduate School Twin Otter sampled the atmosphere at altitudes up to 10,000 feet, measuring droplet and aerosol sizes and how particles scatter and absorb light. NASA’s ER-2 observed from approximately 70,000 feet, looking down on clouds and ocean at finer spatial detail than the satellite but across a narrower area. Its instruments included SPEXAirborne and AirHARP polarimeters, plus the Portable Remote Imaging SpectroMeter and the Pushbroom Imager for Cloud and Aerosol Research and Development. Coordinating these platforms with satellite overpasses allowed comparisons of the same changing conditions from different vantage points.

Forecasts, flight checks and campaign totals
PACE-PAX flight planning began days before takeoff, using forecasts to find aerosol and cloud targets and assess wind limits for the ER-2. Routes were coordinated with the second aircraft, research ships and satellite passes. Teams reviewed conditions, made go-or-no-go decisions and checked each instrument before flight. During sorties, staff monitored data collection and could sometimes adjust equipment remotely or ask the pilot to restart a computer. Debriefs, downloads and instrument adjustments followed landing. By the end of September 2024, the campaign had collected 81 ER-2 flight hours, sixty Twin Otter hours and fifteen days of research-vessel trips. It included sixteen days of targeted observations during PACE overpasses and six during EarthCARE overpasses. Those figures describe flight hours, ship days and overpass-target days respectively, rather than interchangeable counts of flights. In December, public availability of the campaign data was planned to begin in March 2025.
Calibration continued after the first year
The PAC3 meeting brought PACE’s field-campaign, science-and-applications and validation teams together in New York from 18 to 21 February 2025. Instrument updates covered calibration refinements and remaining limitations. OCI Version 3 processing used on-orbit solar-diffuser measurements to improve temporal stability. Ultraviolet degradation in the frequently exposed diffuser was being assessed using a second diffuser exposed only monthly. Other issues included striping near a ten-degree scan angle and reduced accuracy in the 590–610-nanometre region. Processing updates also addressed ultraviolet crosstalk below 340 nanometres, corrections for absorbing atmospheric gases and revised bidirectional reflectance parameters.
SPEXone’s RemoTAP algorithm retrieved aerosol-column properties, size distributions, absorption and vertical extent. Its team compared results with ground-based AERONET Sun photometers and planned further work on radiometric differences with OCI. HARP2’s plans likewise included geolocation and calibration refinements and cross-calibration with the other instruments. The meeting also addressed data access through the Ocean Biology Distributed Active Archive Center, Earthdata Search and supporting software. These continuing activities linked instrument observations, processing algorithms and comparison measurements as scientists developed and assessed the mission’s ocean and atmosphere products.
Leave a comment