
COSI: from cold germanium detectors to gamma-ray sky maps
A launch contract sets the schedule. Detector assembly, calibration and balloon observations show how COSI is being prepared to reconstruct the gamma-ray sky.
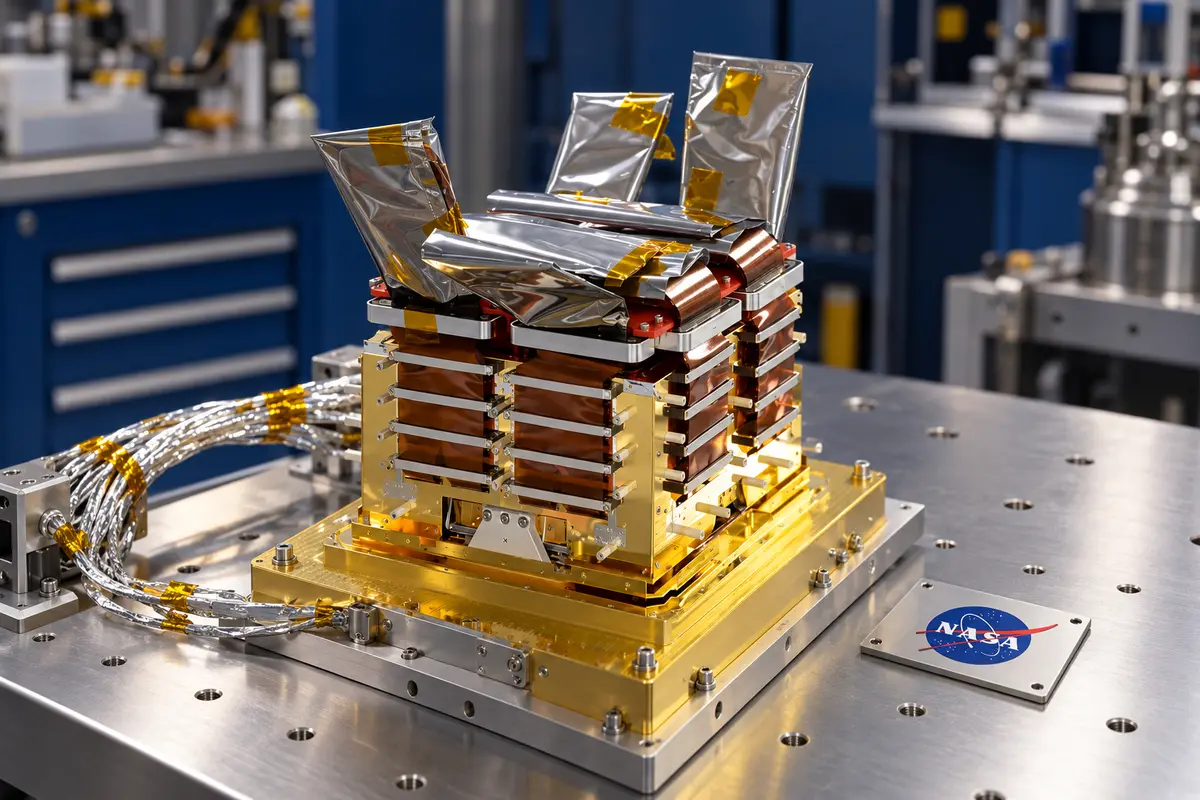
NASA selected SpaceX to launch the Compton Spectrometer and Imager, or COSI, under a fixed-price contract announced on July 2, 2024. The approximately $69 million award covers launch services and associated mission costs. A Falcon 9 was scheduled to carry the gamma-ray observatory from Cape Canaveral Space Force Station in August 2027. That was a launch plan, with spacecraft development still ahead.
COSI's science programme connects several kinds of energetic activity: the origins of galactic positrons, the production of atomic nuclei in stars, gamma-ray polarization and electromagnetic counterparts to events detected through other messengers. Those counterparts could connect gamma-ray measurements with gravitational-wave observations.
The July 2024 launch booking followed NASA's 2021 selection of COSI. Between a booking and usable sky maps lie detector construction, calibration and methods for separating celestial photons from background.

Recording a gamma ray in cold germanium
The flight design described by John Tomsick and colleagues in 2023 uses sixteen germanium detectors in four stacks of four. Each crystal measures eight by eight centimetres and is 1.5 centimetres thick. Perpendicular strip patterns on opposite faces provide two position coordinates; differences in signal rise time provide depth. The design has 64 strips on each face, at a pitch of 1.162 millimetres. A mechanical cryocooler maintains the detectors at approximately 80–90 kelvin. Separate application-specific integrated circuits handle timing and spectroscopy. The readout design assigns six such circuits to each detector, for 96 across the array.
A gamma ray can scatter before depositing its remaining energy. COSI must record the energies and three-dimensional positions of the interactions. The first two interaction positions and energy measurements constrain a circle of possible arrival directions. Combining events builds information about the sky. The design joins three measurements:
- Energy deposited at individual interaction sites.
- Positions inside the germanium crystals.
- The order in which interactions occurred.
Engineering models and flight hardware
The project passed its Critical Design Review on December 4–6, 2024, at Northrop Grumman in Dulles. Subsequent milestones concerned different pieces and stages of the instrument. In May 2025, the team assembled an engineering-model cryostat and completed a cold vacuum test. That configuration combined sixteen real and dummy germanium detectors, two shield walls and operational readout electronics. Its purpose and hardware configuration distinguish it from the later flight-model assembly.
In July 2025, the Cryostat Heat Removal Subsystem began thermal-vacuum testing at Goddard. This subsystem includes the cryocooler, its control electronics, heat pipes and radiators. An October 28 update marked the start of flight-model cryostat assembly and showed the first germanium detector in its holder. On November 20, the team's update recorded the installation of sixteen detectors. These dated steps document progression through testing and assembly; the November milestone did not mean the observatory had begun taking measurements in space.
Engineers continued assembling and aligning COSI's detectors at Berkeley's Space Sciences Laboratory during June and July 2026. On June 12, Christopher Smith adjusted the spacing of the germanium detectors. On June 15, Matt Rubly used a laser to check alignment. Those operations concerned the physical arrangement of detector layers, whose positions must be established before their signals can be used to reconstruct incoming radiation.
On July 8, engineers used a small crane to move the detector assembly toward its baseplate. Flexible circuits carried signals from the detectors to the readout electronics. The assembly's gold enclosure included thermal shielding. On July 15, engineers sealed screw heads with epoxy and attached a second shield; the following day they adjusted flex circuits beneath the assembly. Keeping the detectors below approximately minus 183 degrees Celsius limits thermal noise enough to detect gamma-ray signals. The photographs show cleanroom construction and checks during summer 2026.

Preserving the energy measurement
Inside germanium, an interaction liberates electrons and positively charged holes. An applied voltage moves them toward opposite detector faces, inducing the electrical signals used to infer deposited energy. Trapping interrupts that motion. The resulting energy deficit depends on how far the charge would otherwise have travelled to its electrode. Reading both faces allows researchers to examine the behaviour of the two charge carriers separately.
Sean Pike and colleagues investigated this problem in a study published in January 2025, using a spare detector from the balloon programme. They first characterized its initial spectral resolution and found electron trapping associated with impurities dominated the undamaged detector. Two rounds of proton irradiation then measured how damage produced additional hole traps. The measured product of hole-trap density and trapping cross-section increased linearly with proton fluence, with a slope of (5.4 ± 0.4) × 10−11 centimetres per proton. Calibrations using the measured trapping parameters mitigated the degradation in spectral resolution.
Shield response also needs calibration
The bismuth germanate, or BGO, anticoincidence shield has two roles: reducing background in the germanium instrument and monitoring transient activity. Light produced in a shield crystal must reach its silicon photomultipliers. Consequently, the response depends on where an interaction occurs and how light propagates through the material. Alex Ciabattoni and colleagues examined that response in a study posted in July 2025.

The team used optical simulations in Geant4 to build a correction matrix, then compared the calculations with laboratory measurements of a lateral shield wall. The model incorporated BGO absorption length and electronic noise. Maximum discrepancies were about 20% for energy resolution and 10% for light-collection uniformity. Accounting for position-dependent quantum efficiency changed the response relative to its average: approximately 8% higher near the photomultipliers and 2% lower near corners. The team also modelled the smaller bottom crystals. These comparisons establish the accuracy of particular simulation and laboratory configurations, with their remaining differences, rather than reporting performance measured by the complete observatory in orbit.
Accounting for radiation made around the detector
Radiation produced within an instrument can obscure radiation arriving from an astronomical source. Savitri Gallego and colleagues investigated this background using COSI's 2016 balloon flight, publishing their analysis in March 2025. Cosmic rays can activate instrument materials, producing radioactive nuclei whose later decays contribute gamma rays. The researchers identified this activation as a dominant background component in the balloon data.
Their approach combined Monte Carlo calculations with phenomenological corrections to the predicted spectral shape. The corrected model agreed with measured background to within about 10–20% over the tested range from 0.1 to 1.6 megaelectronvolts, reproducing most activation lines. That energy interval and the balloon configuration define the scope of the comparison. The forthcoming satellite was planned for an equatorial orbit around 530 kilometres high. Its radiation environment would differ from a balloon's. A model tested against a long balloon dataset provides a basis for background work while retaining those differences in operating conditions.

The next stage converts detector events into estimates of sky emission. In their 2023 description of cosipy, Israel Martinez-Castellanos and colleagues explain that interaction separations are too small to determine their sequence from timing alone. Reconstruction therefore uses Compton-scattering kinematics. Each event enters a multidimensional data space that includes scattering angle and the outgoing direction. Finite energy resolution and missed interactions broaden the instrument's response. Scattering also carries polarization information: the distribution of azimuthal scattering angles constrains polarization direction and fraction, adding another measurement to the reconstructed spectrum and position.
The cosipy analysis framework forward-folds a proposed sky model through a detector-response matrix, then compares the expected counts with observations using a likelihood that includes background. Response calculations use simulations of the instrument's active and passive components. The Python software also connects to the Multi-Mission Maximum Likelihood framework, enabling joint analyses with other instruments. In 2023, the software remained preliminary, with further work needed to optimize memory and computing use. Public data challenges were intended to allow scientists to test the pipeline and become familiar with COSI-like data before launch.
Testing maps before there is a satellite dataset
Sky reconstruction must accommodate compact sources and extended emission together. Hiroki Yoneda and colleagues addressed this in an April 2025 study of a modified Richardson–Lucy algorithm. Their method combined a maximum-a-posteriori approach with priors favouring sparsity and smoothness, while simultaneously optimizing background components. The two priors served different purposes: sparsity suppressed artificial structures around point sources, while smoothness helped preserve extended emission.

The tests used simulated observations of titanium-44, aluminium-26 and electron–positron annihilation emission. These included a model of the 0.511-megaelectronvolt sky containing both point-like and diffuse components. In those simulations, different spatial models could be distinguished with an exposure corresponding to three months of early COSI operations. That result concerns assumed skies, instrument response and simulated counts. Yoneda's team proposed further work on spatially varying priors and additional background information. Those changes would extend the tested reconstruction method, whose maps were simulated examples rather than observations made by the future satellite.
What the balloon already measured
COSI's 2016 balloon flight supplied real observations for testing diffuse-emission analysis. Christopher Karwin and colleagues reported its Galactic continuum results in a paper posted in October 2023. They found agreement, within uncertainties, with measurements from INTEGRAL's SPI instrument and the earlier COMPTEL telescope. The comparison required attention to sky coverage: the COSI region extended to Galactic longitudes of approximately 65 degrees and latitudes of 45 degrees from the centre, while comparison measurements used different boundaries.
Source subtraction also differed. The balloon flux retained point-source contributions; the INTEGRAL comparison had subtracted 256 resolved sources. Changing balloon altitude affected background normalization, and a full treatment of systematic uncertainties remained outside the study's scope. The authors separately estimated contributions from unresolved sources using matched Swift and Fermi catalogues. Their extrapolations put the maximum estimated unresolved-source share near 30% at 0.2 megaelectronvolts. The authors also compared the observations with GALPROP calculations. Those models underpredicted existing diffuse-emission data by factors of roughly two to three, leaving a discrepancy for further investigation. The measured continuum therefore retained contributions and uncertainties associated with observing region, source populations and background.

Jarred Roberts and colleagues examined point sources in the same 46-day balloon flight, publishing their results in December 2024. They detected the Crab, Cygnus X-1 and Centaurus A. Recovering those sources required image reconstruction against substantial background. The researchers used Richardson–Lucy deconvolution and fitted spectra jointly with data from other observatories, extending the energy information available from the balloon alone.
For the Crab, the measured flux between 325 and 480 kiloelectronvolts was (4.5 ± 1.6) × 10−3 photons per square centimetre per second. Joint Crab fits with NuSTAR and Swift data used a broken power law, with an index of 2.20 ± 0.02 above a 43-kiloelectronvolt break. For Cygnus X-1 in the same band, it was (1.4 ± 0.2) × 10−3. Joint observations with NuSTAR, Swift and INTEGRAL constrained a cutoff-power-law description of Cygnus X-1, with a cutoff near 138 kiloelectronvolts. Centaurus A's spectrum was described by a power law. Each fit combined the balloon measurements with additional spectral information from the other instruments. The measurements came from the earlier balloon platform, preceding the planned satellite survey.
A companion instrument for transients
The Background and Transient Observer, or BTO, is a student collaboration experiment intended to fly with COSI. BTO's design, presented in July 2024 by Hannah Gulick and colleagues, included two sodium iodide scintillation detectors and student-developed readout electronics. Its planned spectral coverage runs from 30 kiloelectronvolts to 2 megaelectronvolts, extending below COSI's 200-kiloelectronvolt lower boundary. The companion instrument would therefore add measurements of lower-energy radiation during transient events.

BTO's simulated targets included gamma-ray bursts, magnetar giant flares and terrestrial gamma-ray flashes. Gulick's team examined their detectability and forecast roughly 150 gamma-ray bursts per year, mostly long bursts. The forecast is a model-based expectation for the proposed instrument and observing conditions. It is not a count collected by BTO. The two-detector design, electronics and transient simulations form part of preparations for observing brief events whose spectra can span the overlapping energy ranges of the companion and main instruments.
Choosing a scintillator that recovers quickly
The scintillator's behaviour after a charged-particle hit affects when another event can be measured. Gulick's team published a comparison of thallium-doped sodium iodide and caesium iodide cylinders in January 2025. Each cylinder was 5.1 centimetres in height and diameter, read out with silicon photomultipliers. At the Heavy Ion Medical Accelerator in Chiba, the team exposed them to helium ions at 230 megaelectronvolts per nucleon and carbon ions at 350 megaelectronvolts per nucleon.
The caesium iodide afterglow lasted about 2.40 milliseconds following carbon-ion exposure and 0.9 milliseconds after helium exposure. Sodium iodide recovered in approximately 0.28 and 0.16 milliseconds respectively. The longer caesium iodide afterglow implied a tradeoff: around seven times as much deadtime, or an energy threshold roughly three times higher, under the study's comparison. Modelling a two-detector BTO-like system placed these beam-test results in an orbital-background context. The researchers favoured sodium iodide for this application despite caesium iodide's higher light yield and radiation hardness. The selection connects a material's measured recovery behaviour with the planned task of detecting short-lived signals.
Leave a comment